Partners - CC and Ben
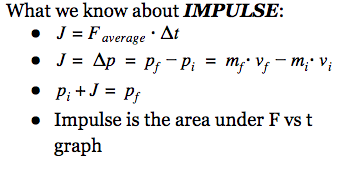
What is Being Verified
Lab Setup
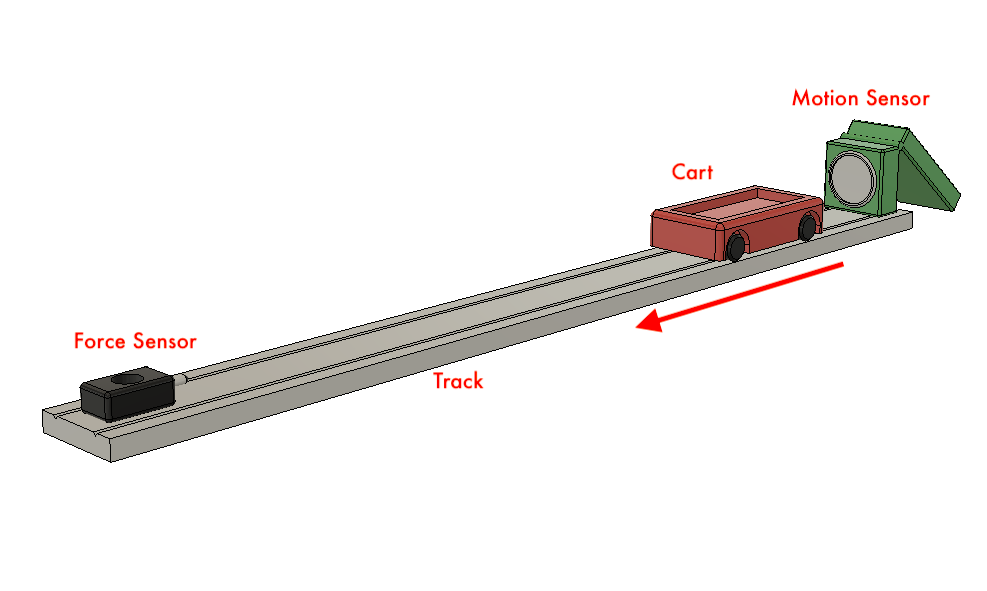
Push the cart towards the force sensor and wait for it to bounce off it and come back.
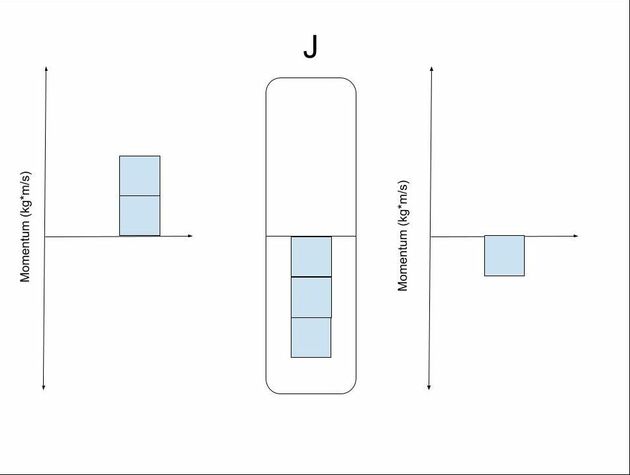
Momentum Bar Chart
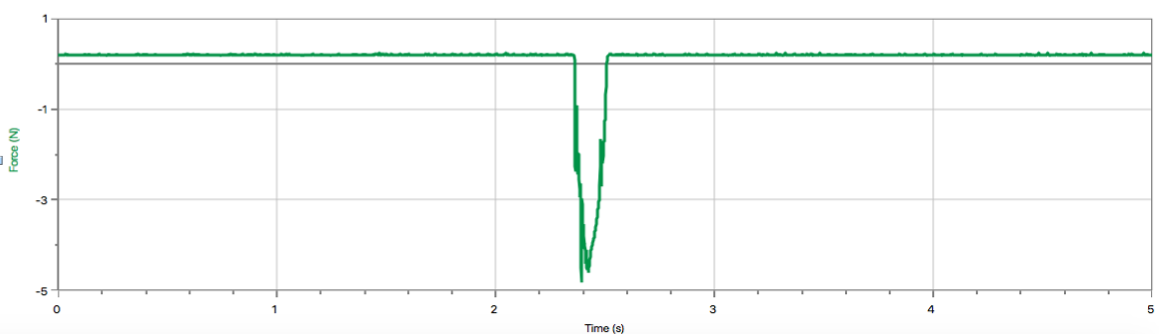
Graphs
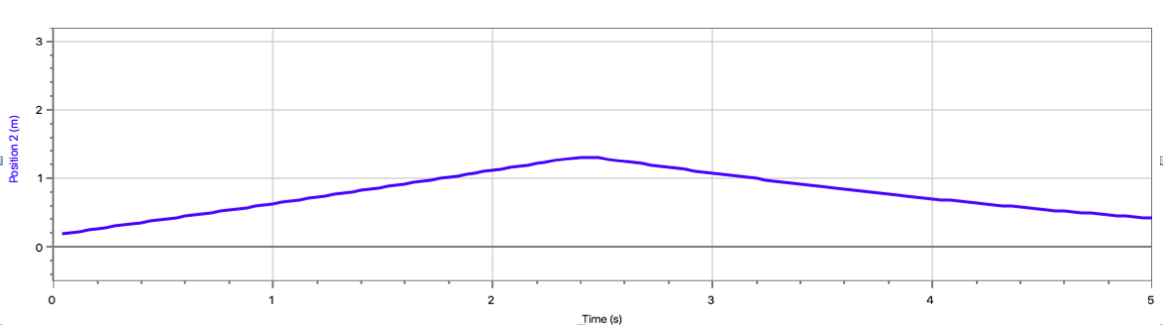
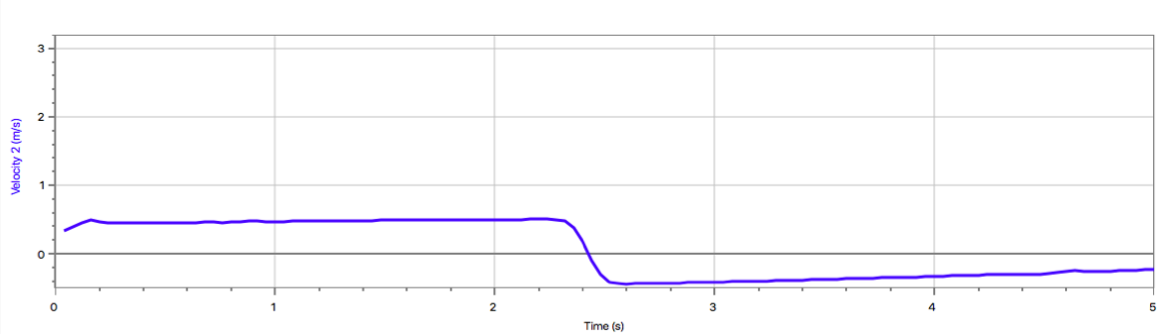
Red - velocity (m/s) vs time (s)
Black - Momentum (kg*m/s) vs time (s)
Black - Momentum (kg*m/s) vs time (s)
Calculations
Initial Momentum = Initial Velocity * Mass = 0.47 m/s * 0.252 kg = 0.11844 kg*m/s
Final Momentum = Final Velocity * Mass = -0.45 m/s * 0.252 kg = -0.1134 kg*m/s
Impulse (change in momentum) = -0.1134 - 0.11844 = -0.23184 kg*m/s
Impulse from Force vs. Time graph = Area under the graph = -0.22796 kg*m/s
Percent Difference = |-0.22796+0.23184|/-0.22796 = 1.70%
Final Momentum = Final Velocity * Mass = -0.45 m/s * 0.252 kg = -0.1134 kg*m/s
Impulse (change in momentum) = -0.1134 - 0.11844 = -0.23184 kg*m/s
Impulse from Force vs. Time graph = Area under the graph = -0.22796 kg*m/s
Percent Difference = |-0.22796+0.23184|/-0.22796 = 1.70%
Evaluation of Data
This experiment verified that impulse is the change in momentum and the area under a force vs time graph. In the experiment, my group pushed a cart at a force sensor and when they collided, the cart started moving in the opposite direction. The impulse is that was calculated from the difference of the two momentums is almost the same as the impulse calculated by logger pro. The percent difference is only 1.7% which can be attributed to errors in representing the data on desmos. In order to represent the data, the initial and final momentums needed to be approximated which could have affected the data. Another source of error is that we disregarded friction in the lab even though there is a small amount of friction between the wheels and the ramp.
Widget is loading comments...
